
Dependency Wheel
Dependency wheel, a chord diagram that shows what hangs on what.
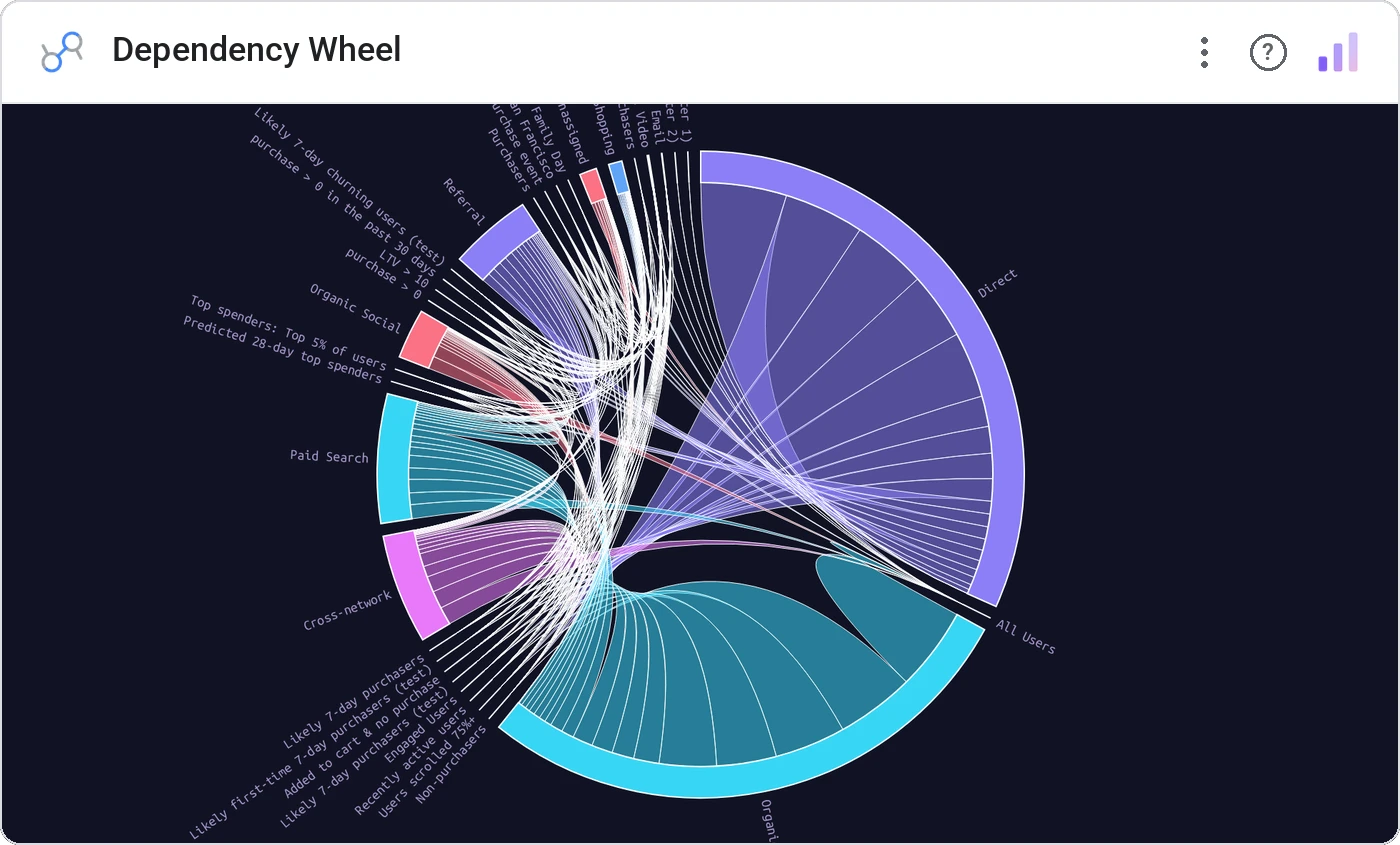
Dependency Wheel arranges entities around a ring and draws directed arcs showing dependency strength. Hover one node to see exactly what it depends on (and what depends on it).
Circular node layout with directed dependency arcs, hover-highlight an ego dependency network, optional tick marks and group palettes.
Software, supply chains, and org topologies all have implicit dependency graphs. This makes them visible.
Three ways teams use it.
Service-to-service dependency map.
Supplier dependency for a critical SKU.
Process dependencies for a control audit.
Add it in 30 seconds.
Open your Data Studio report and click Add a chart → Community visualizations → Explore more.
Paste the Viz Studio manifest URL or pick this chart from the Viz Studio gallery card.
Bind the dimensions and metrics in the data panel. Done.
More from Networks, Flows & Relationships
All 75+ charts →
Node-link arc diagram: relationships you can actually trace.

Proportional circles for audience segments: overlaps you can see.

Two columns, every link explicit: A-to-B relationships made obvious.

Circular chord ribbons: every pairwise flow, perfectly weighted.
Included in your vizstudio plan.
One plan, everything in it: the full library of 75+ charts. No per-seat upcharges, no metering. Build a real dashboard before you pay a cent.
Start free →