
Bipartite Graph
Two columns, every link explicit: A-to-B relationships made obvious.
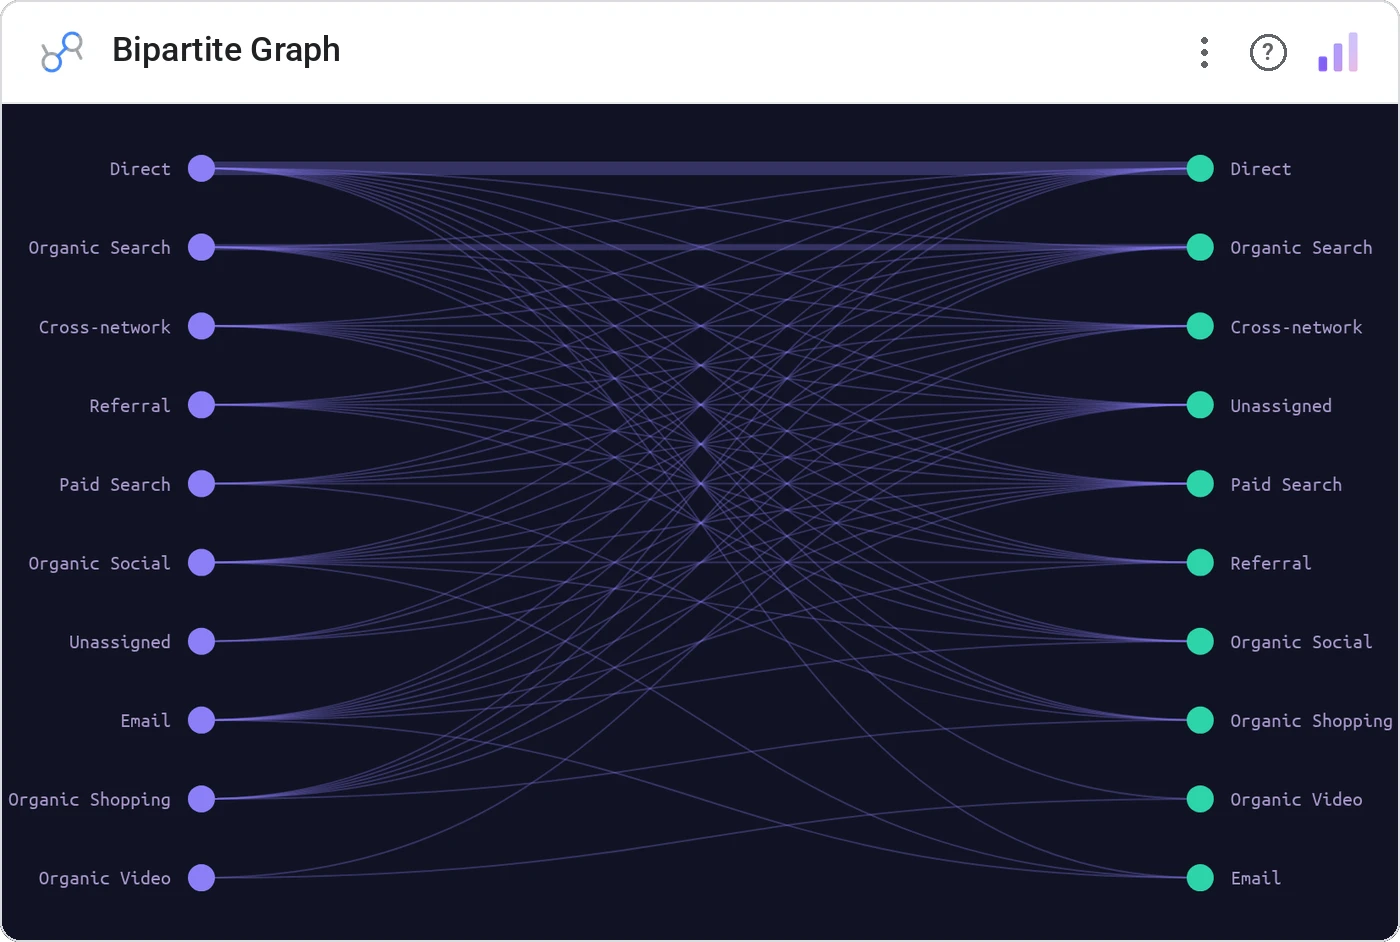
Bipartite Graph stacks two node groups in parallel columns and draws every link between them. When you have a clean A-side and B-side relationship (customer-to-product, user-to-feature, doctor-to-prescription), bipartite reads in seconds.
Two parallel columns of labeled nodes with weighted links connecting the sides; hover-highlight an ego network.
Cleaner than a force graph when the structure is genuinely two-sided.
Three ways teams use it.
Customers ↔ purchased categories.
Doctors ↔ prescribed drugs (anonymized).
Candidates ↔ skills required.
Add it in 30 seconds.
Open your Data Studio report and click Add a chart → Community visualizations → Explore more.
Paste the Viz Studio manifest URL or pick this chart from the Viz Studio gallery card.
Bind the dimensions and metrics in the data panel. Done.
More from Networks, Flows & Relationships
All 75+ charts →



Included in your vizstudio plan.
One plan, everything in it: the full library of 75+ charts. No per-seat upcharges, no metering. Build a real dashboard before you pay a cent.
Start free →