
Stream Wave Chart
Stream wave: streamgraph with a wavier silhouette for editorial flair.
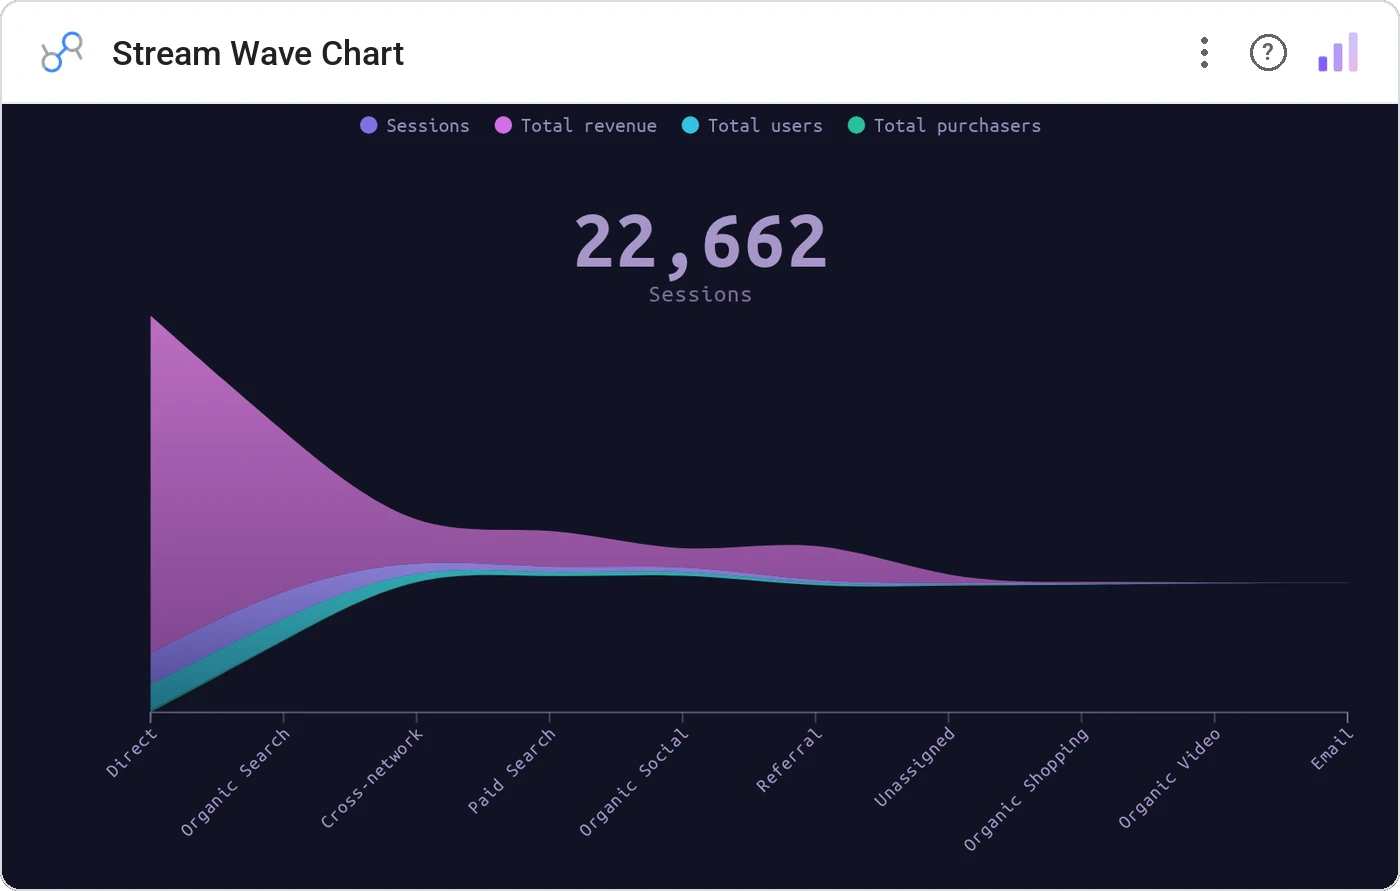
Stream Wave Chart is a streamgraph variant tuned for design-forward dashboards: smoother silhouettes, configurable curvature, and theme-aware accent gradients. The streamgraph you put on a marketing page.
Streamgraph with extra silhouette smoothing, configurable curvature, accent gradients, tooltip.
Streamgraphs are striking; stream wave makes them gallery-ready.
Three ways teams use it.
Brand campaign mix over a launch period.
Topic share for a year-in-review.
Article output per author over months.
Add it in 30 seconds.
Open your Data Studio report and click Add a chart → Community visualizations → Explore more.
Paste the Viz Studio manifest URL or pick this chart from the Viz Studio gallery card.
Bind the dimensions and metrics in the data panel. Done.
More from Time Series & Trends
All 75+ charts →
Rank-over-time line chart: who's climbing, who's sliding.
Two metrics, two scales, one line of sight: without the lie factor.
Stacked area over time: composition and trend on the same canvas.

Same signed stacked bar, animated entrance + zoom controls.
Included in your vizstudio plan.
One plan, everything in it: the full library of 75+ charts. No per-seat upcharges, no metering. Build a real dashboard before you pay a cent.
Start free →