
Revenue Breakdown (Bar + Line Combo)
Revenue mix bars + margin line, the public-company readout view.
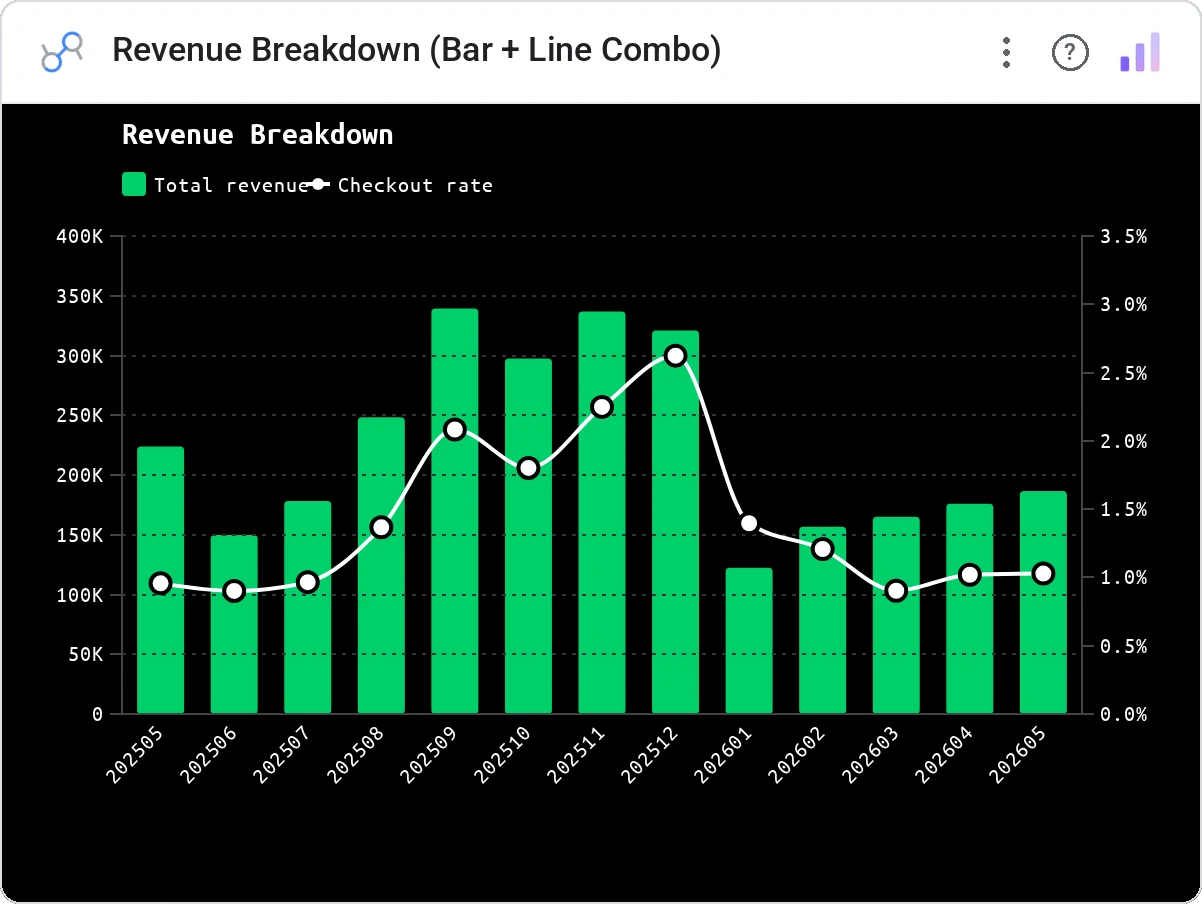
Revenue Breakdown is a grouped bar chart with up to 4 bar metrics and an optional line overlay (e.g. Net Margin %). Dark theme with a green color scheme, legend, tooltip, cross-filter, and a Quarterly / Annual view toggle.
Grouped bars for up to 4 revenue components per period plus an optional overlay line for a ratio metric (margin %, etc.); Q/A view toggle.
Designed for the way public-company earnings actually look: revenue mix + margin trend on one panel.
Three ways teams use it.
Quarterly segment revenue + net margin %.
New / expansion / churn / contraction bars + NRR line.
Channel mix bars + same-store growth line.
Add it in 30 seconds.
Open your Data Studio report and click Add a chart → Community visualizations → Explore more.
Paste the Viz Studio manifest URL or pick this chart from the Viz Studio gallery card.
Bind the dimensions and metrics in the data panel. Done.



Included in your vizstudio plan.
One plan, everything in it: the full library of 75+ charts. No per-seat upcharges, no metering. Build a real dashboard before you pay a cent.
Start free →