
Portfolio Pie Barcode
Portfolio pie + barcode: composition and per-position detail in one chart.
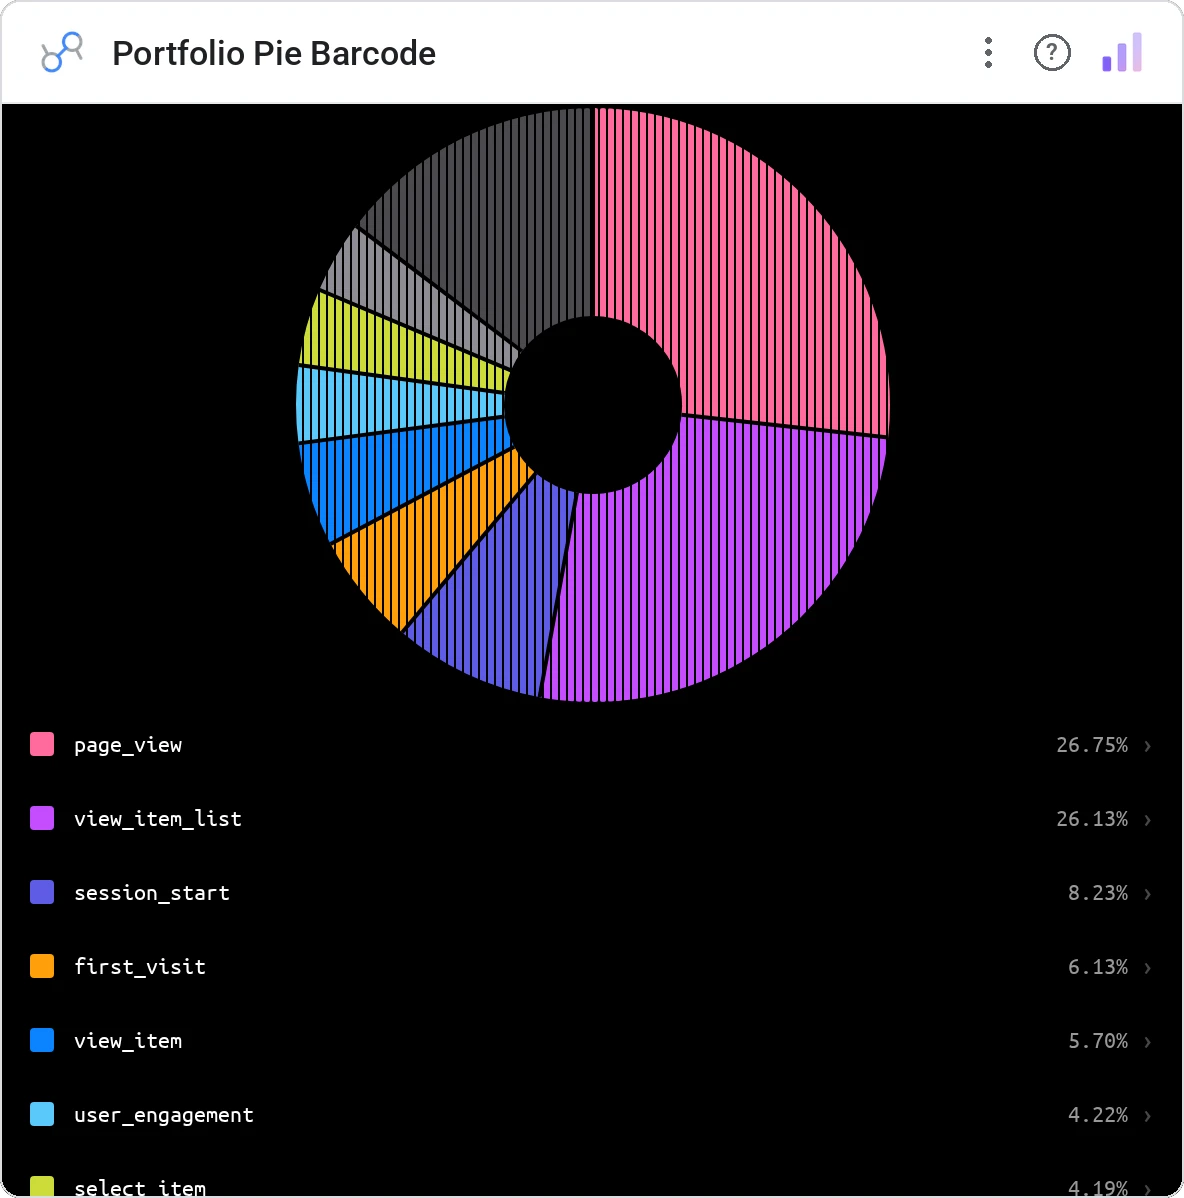
Portfolio Pie Barcode pairs the macro view (sector or asset-class pie) with the micro view (per-position barcode) in a single composition. The portfolio overview that doesn’t force a click-through.
Pie chart for top-level composition next to a barcode strip for every individual position; click a slice to filter the strip.
Two questions (sector mix and per-position weight) answered on one canvas.
Three ways teams use it.
Sector pie + position barcode for a daily review.
Stage pie + investment barcode.
Asset class pie + holding barcode.
Add it in 30 seconds.
Open your Data Studio report and click Add a chart → Community visualizations → Explore more.
Paste the Viz Studio manifest URL or pick this chart from the Viz Studio gallery card.
Bind the dimensions and metrics in the data panel. Done.
More from Networks, Flows & Relationships
All 75+ charts →
Node-link arc diagram: relationships you can actually trace.

Proportional circles for audience segments: overlaps you can see.

Two columns, every link explicit: A-to-B relationships made obvious.

Circular chord ribbons: every pairwise flow, perfectly weighted.
Included in your vizstudio plan.
One plan, everything in it: the full library of 75+ charts. No per-seat upcharges, no metering. Build a real dashboard before you pay a cent.
Start free →