
Adjacency Matrix
Adjacency matrix, the most scalable way to see a network.
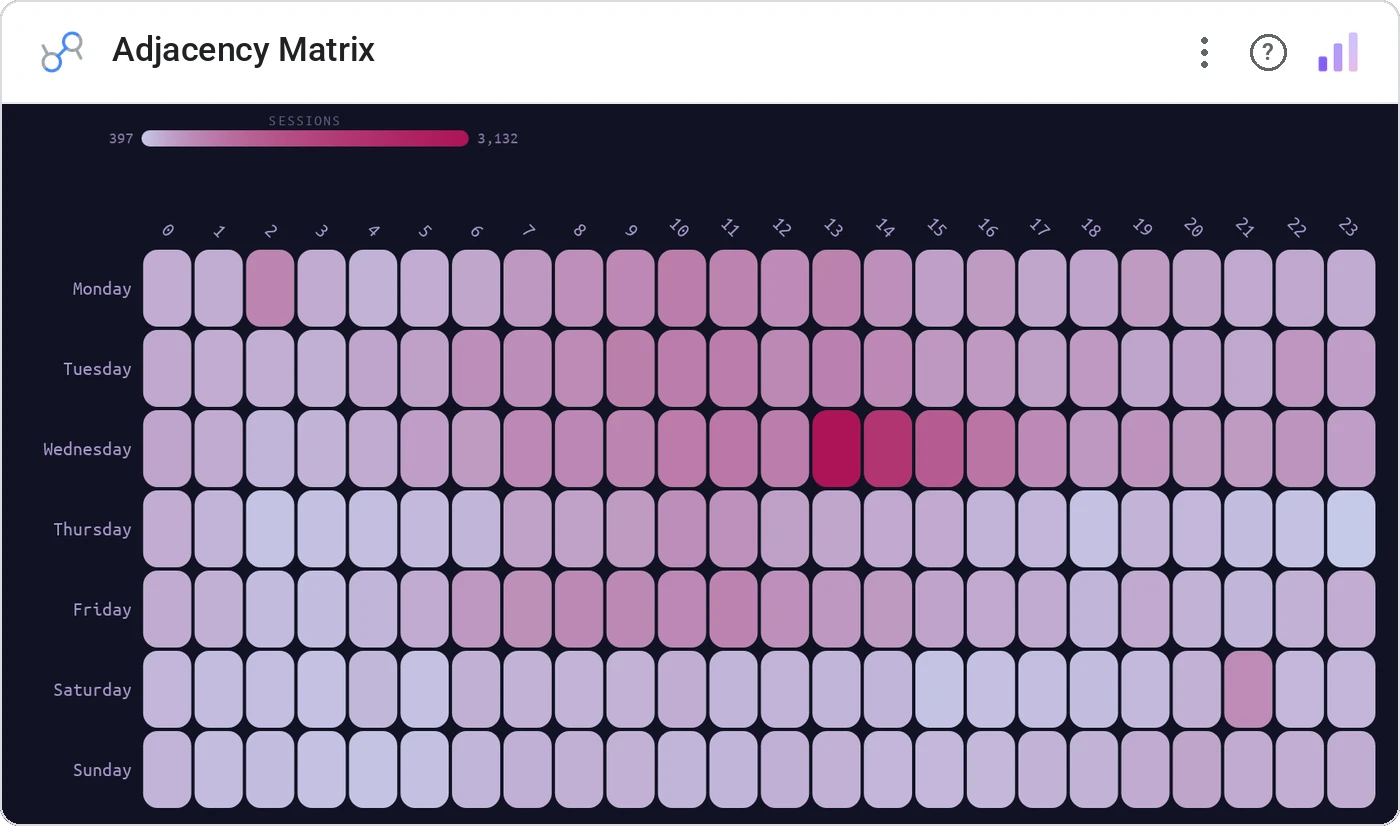
Adjacency Matrix lists every entity along both axes and shades each cell by edge weight. When force graphs become spaghetti at 100+ nodes, the matrix stays readable.
Entity × entity grid with cell tint = edge weight, sortable axes, hover detail, cross-filter on click.
Networks past ~50 nodes are unreadable as graphs. Matrices keep scaling.
Three ways teams use it.
Service call graph at scale.
Customer ↔ channel matrix.
Email volume between teams.
Add it in 30 seconds.
Open your Data Studio report and click Add a chart → Community visualizations → Explore more.
Paste the Viz Studio manifest URL or pick this chart from the Viz Studio gallery card.
Bind the dimensions and metrics in the data panel. Done.
More from Networks, Flows & Relationships
All 75+ charts →
Node-link arc diagram: relationships you can actually trace.

Proportional circles for audience segments: overlaps you can see.

Two columns, every link explicit: A-to-B relationships made obvious.

Circular chord ribbons: every pairwise flow, perfectly weighted.
Included in your vizstudio plan.
One plan, everything in it: the full library of 75+ charts. No per-seat upcharges, no metering. Build a real dashboard before you pay a cent.
Start free →