
A/B Test Results
CI bars for A/B variants: significance baked in.
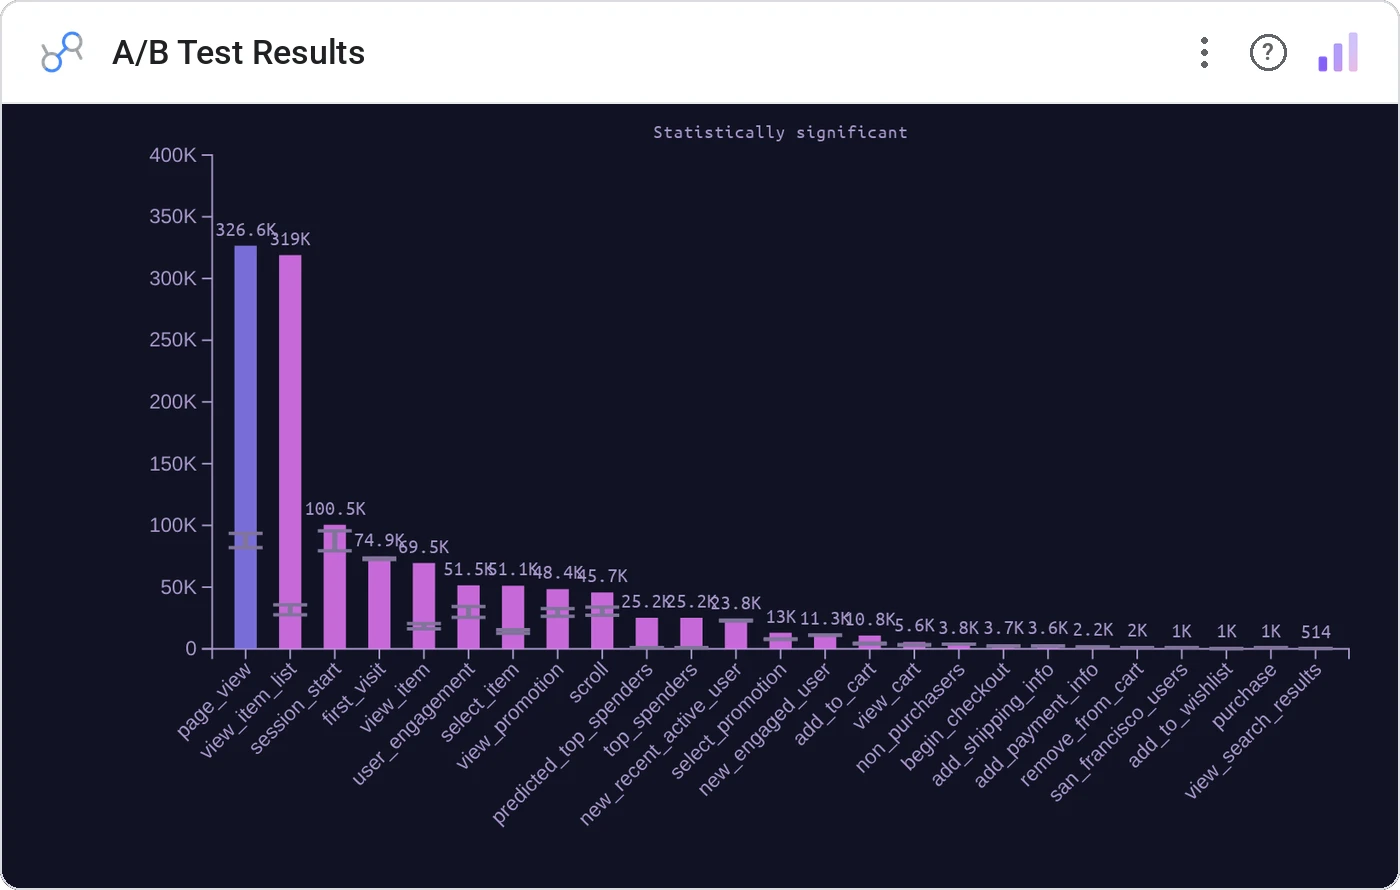
Stop screenshotting your stats notebook. A/B Test Results renders each variant as a horizontal bar with confidence intervals, sample size, and a clear winner annotation, so PMs and execs read the same number you do.
Plots variant means with 95% CI whiskers, annotates statistically significant winners, and surfaces sample size + lift % on hover.
It moves the conversation from "which one looks better?" to "which one is real?" without a stats lecture.
Three ways teams use it.
Landing-page CTA test: show lift with confidence band, not a single number.
Feature-flag experiments rolled up by cohort and surface.
Subject-line and creative tests reviewed in a weekly readout.
Add it in 30 seconds.
Open your Data Studio report and click Add a chart → Community visualizations → Explore more.
Paste the Viz Studio manifest URL or pick this chart from the Viz Studio gallery card.
Bind the dimensions and metrics in the data panel. Done.
More from Bars, Columns & Ranking
All 75+ charts →
The animated bar chart race that wins every monthly review.

Animated curved columns: bars that arc to draw the eye.

Curved columns, static, the still-frame version with the same elegance.

Two dots, one line: every gap between A and B made obvious.
Included in your vizstudio plan.
One plan, everything in it: the full library of 75+ charts. No per-seat upcharges, no metering. Build a real dashboard before you pay a cent.
Start free →