
Slice / Dice Treemap
Slice / dice treemap: horizontal, vertical, or alternating tiling.
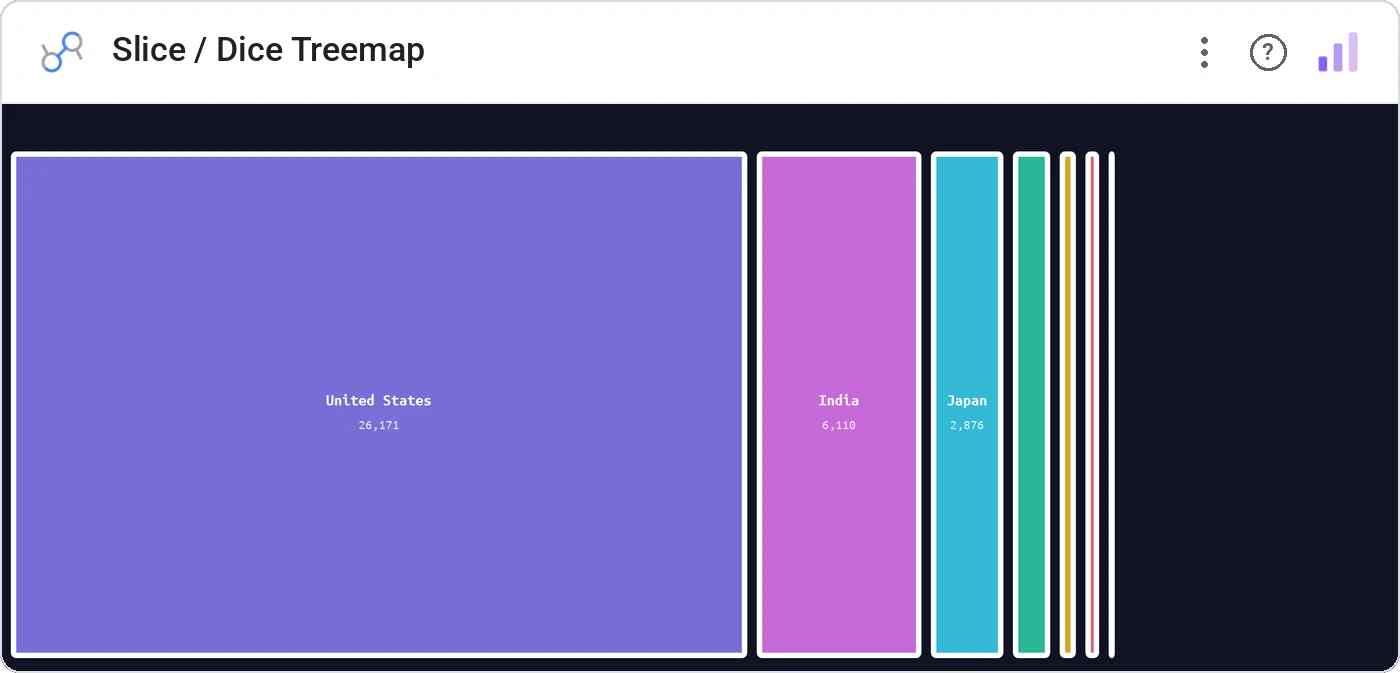
Slice / Dice Treemap gives you three classic tiling algorithms: slice (horizontal stripes), dice (vertical stripes), or slice-dice (alternating), so the structure of your hierarchy *looks* like hierarchy, not a random rectangle pile.
Treemap with slice/dice/slice-dice tiling, multi-dimension drilldown, click-to-zoom, breadcrumb navigation, theme-aware colors.
Squarified treemaps prioritize compactness over structure. Slice/dice prioritizes the hierarchy itself: easier to read at depth.
Three ways teams use it.
Sector → industry → ticker treemap.
Division → team → person headcount.
Category → tag → article volume.
Add it in 30 seconds.
Open your Data Studio report and click Add a chart → Community visualizations → Explore more.
Paste the Viz Studio manifest URL or pick this chart from the Viz Studio gallery card.
Bind the dimensions and metrics in the data panel. Done.



Included in your vizstudio plan.
One plan, everything in it: the full library of 75+ charts. No per-seat upcharges, no metering. Build a real dashboard before you pay a cent.
Start free →